
Figure 1: Structured multiblock grid for Potsdam propeller blade.
1700 words / 8 minutes read
Introduction
In the previous article on open water propeller blade, we covered aspects of the domain, zones, and interfaces, boundaries conditions, grid refinement, in particular the wake, blade tip refinement to capture the cavitation vortices. In this final article in the series, we try to address aspects of grid influences on the solution flow field, including, grid uncertainty analysis for wetted vs cavitating flows conditions, mesh refinement studies using both sequential grids and adaptively refined grids and lastly model vs full-scale propeller blade performance.
Video 2: Cavitation CFD simulation using MARIN ReFRESCO solver.
Uncertainty Analysis of Wetted vs Cavitation Flows
Overall, the grid uncertainty levels of both wetted and cavitating results are low and is less than 1 percent. But the main difference between them is in the order of convergence of performance coefficients, which is low for the cavitating case than wetted flow. In wetted flow conditions, since grid sensitivities mainly occur around the blade tip, the thrust converges more slowly than torque. Figure 2 shows the radial distribution of thrust coefficient for the two cases.
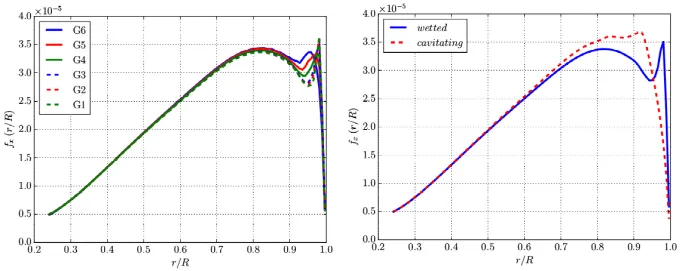
Figures 2a and 2b show the comparison for the two cases. The reduction in tip loading for the cavitating case is quite evident. This is mainly because of the presence of sheet cavitation which lowers the suction peak strength and leading-edge vortex. Interestingly, even though the suction peak close to the tip is absent compared to the wetted flow condition, a larger lower pressure area exists due to the cavity.
Grid Refinement Study ( GCS and AGR)
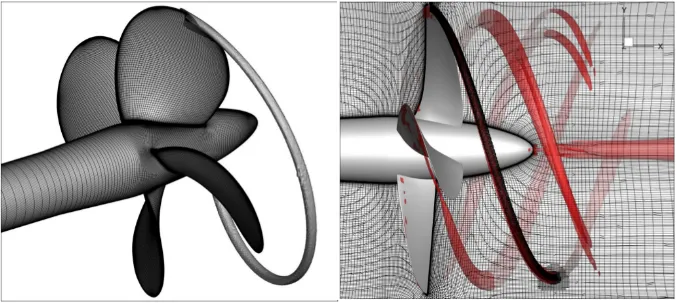
One region which shows remarkable improvement with grid refinement is the tip vortex region, where the cavity extensions are visibly significant with successive grids. One noteworthy aspect is that, even though the cavity extent is limited by the increasing eddy viscosity when using RANS, adaptive grid refinement aids in better capturing of tip vortex cavitation with lesser total cell count.
In fact, one researcher concludes in a paper that, the grid resolution is more important than cavitation modeling parameters when predicting the inception of tip vortex cavitation.
Vapour Volume Uncertainty Analysis
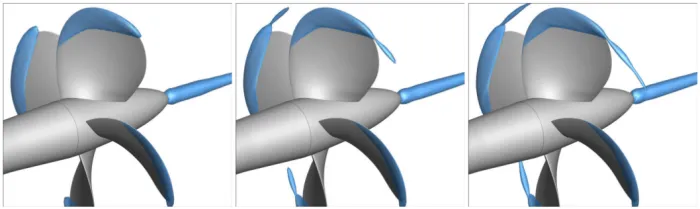
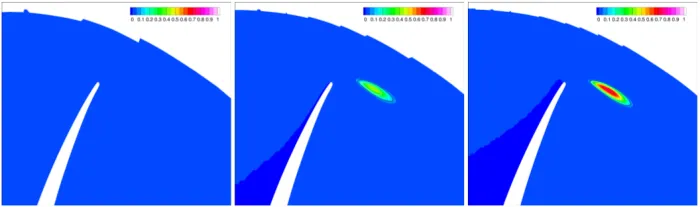
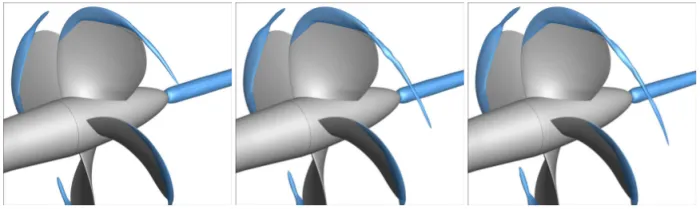
This analysis helps to examine the effect of grid refinement on cavitation flow prediction. Figure 4 shows the cavity extents for 3 different grids refined at a rate of 1.5, visualized using iso-surfaces of vapour volume fraction.
From Figure 4, it can be observed that the form of the sheet cavity is less sensitive to grid refinement. This is somewhat expected, as given the low grid uncertainty of the thrust, which is directly related to the pressure distribution on the blade.
However, the tip vortex cavity shows a large grid dependency. For the first grid, there is no noticeable tip vortex cavitation. For the second refined grid, the tip vortex begins to cavitate. For the third refined grid, the cavity extension increases. On the finest grid, one can observe that the vortex rolls-up and form the characteristic ‘necked’ appearance.
Analysis of the Cavitating Flow Field
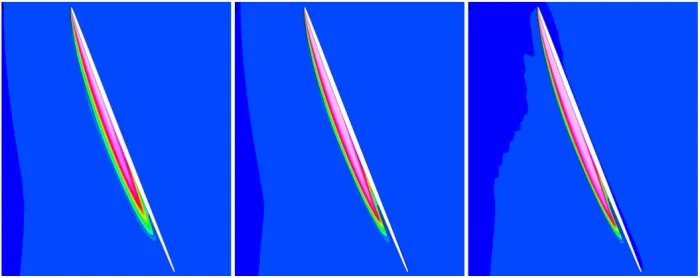
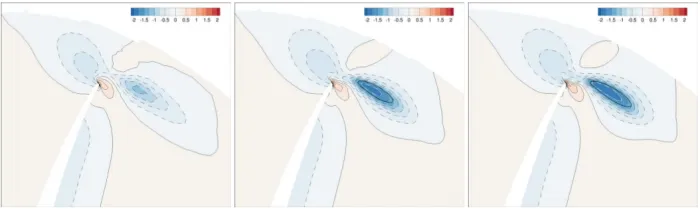
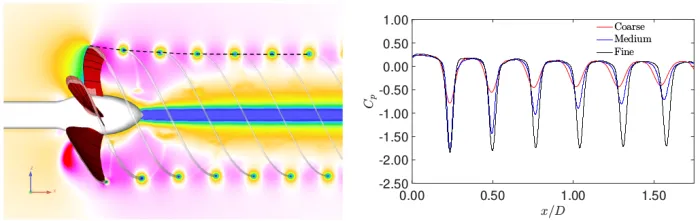
Even though the predicted sheet cavity shape did not appear to vary significantly with grid refinement, the variation on a 2D slice shows more subtle differences as shown in Figure 5. Here, the liquid-vapour interface and re-entrant jet resolution become sharper with refinement.
Adaptive Grid Refinement
Improvement in predicting tip vortex cavitation can be done using adaptive grid refinement with fewer grid cells.
By comparing Figure 10 and Figure 4 with Figure 3, one can appreciate the differences between computations with and without adaptive grid refinement. The tip vortex cavity extension in the L1 adaptive grid is of similar length to that obtained on the finest grid in the sequential family (Figure 10a). With further increase in local refinement, not only does the tip vortex cavitation becomes longer, but the roll-up of the tip vortex also gets better resolved (Figure 10b,10c).
Model vs Full-Scale Performance
Contrary to intuition, solutions obtained on a model scale cannot be extrapolated to the real-life full-scale propeller model. This is rightly so because with increase in geometry dimensions the Reynolds number at which computations are done increases and as a consequence, the flow patterns also change significantly. The numerical predictions performed at the model scale are more challenging than those at full scale due to the simultaneous cohabitation of laminar and turbulent flow regimes and the subsequent difficulty in the accurate prediction of the transition from laminar to turbulence in the computations.
Also, the propeller blade performance characteristics vary between the model and a full-scale geometry. Analysis of the results shows that the full-scale simulations yield a bit higher thrust coefficient, a slightly lower torque coefficient and consequently a higher open-water efficiency. It is interesting to note that, just like the model-scale, full-scale propeller efficiency does not show a great dependency on the grid density and the performance characteristics converge monotonically towards the experimental values.
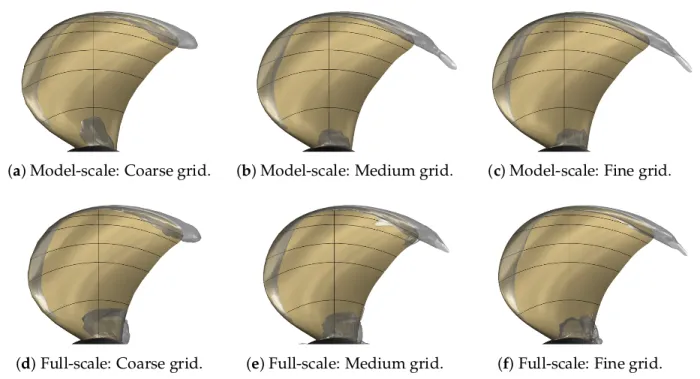
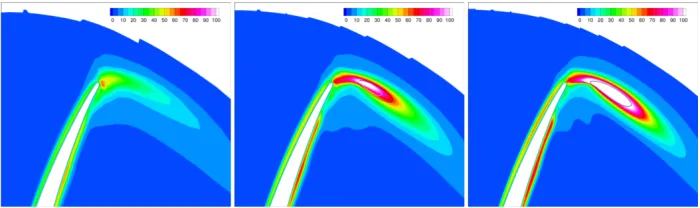
Figures 11, 12 show the near-blade and overall cavitation predicted on different grid densities for both model and full-scaled propeller blade. As can be observed from Figure 11, near-blade cavitation is quite similar to each other on various grids. On all grids, sheet cavitation develops at the leading edge which then transforms to tip vortex cavitation. The root cavitation also grows in extent with increase in grid resolution but only marginally. Looking at Figure 11, it will be safe to say that the near-blade cavitation is mostly independent of the utilized grid densities.
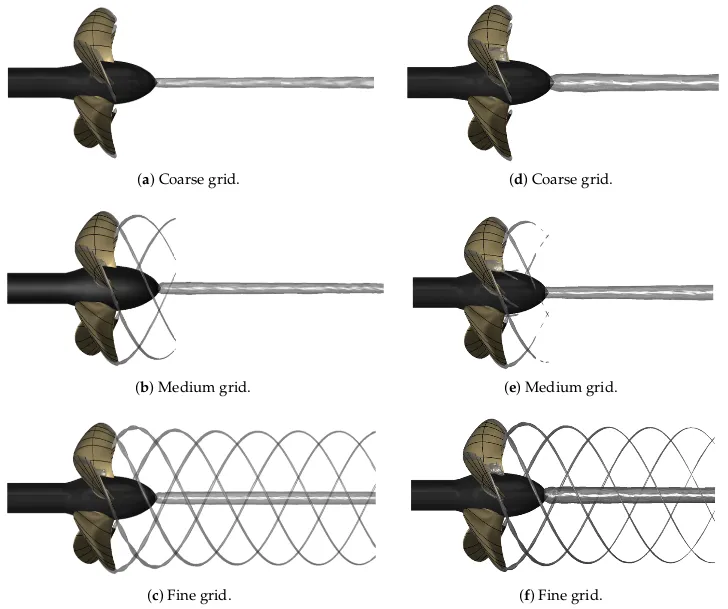
However, we do not see such a clear grid density influence in hub vortex cavitation. The hub vortex predicted by the medium grid matches very well with fine grid results and experiments.
Parting Thoughts
As these results emphasize, local refined grids bring in a significant improvement in flow feature prediction and which in turn makes the flow parameter prediction more accurate and compares well with the experimental results. Whether the refinement is through sequential grids or by adaptive grid refinement, the benefits of such an exercise are quite evident as underscored in this article.
Further Reading:
- Multiblock meshing of Ship Propeller
- Meshing Aspects for Open Water Marine Propeller CFD
- Cavitation in Turbines.
- CFD Modelling of Submarines
References
1. “Comparison of Hexa-Structured and Hybrid-Unstructured Meshing Approaches for Numerical Prediction of the Flow Around Marine Propellers”, Mitja Morgut et al, First International Symposium on Marine Propulsors smp’09, Trondheim, Norway, June 2009.
2. “Grid Type and Turbulence Model Influence on Propeller Characteristics Prediction”, Ante Sikirica et al, Journal of Marine Science and Engineering, J. Mar. Sci. Eng. 2019, 7, 374.
3. “Numerical simulation of propeller open water characteristics using RANSE method”, Tran Ngoc Tu, Alexandria Engineering Journal, (2019) 58, 531–537.
4. “Computational fluid dynamics prediction of marine propeller cavitation including solution verification”, Thomas Lloyd et al, Fifth International Symposium on Marine Propulsors smp’17, Espoo, June 2017.
5. “Improving accuracy and efficiency of CFD predictions of propeller open water performance”, M. F. Islam et al, Journal of Naval Architecture and Marine Engineering, June, 2019.
6. “An Investigation into Computational Modelling of Cavitation in a Propeller’s Slipstream”, Naz Yilmaz et al, Fifth International Symposium on Marine Propulsion smp’17, Espoo, Finland, June 2017.
7. “A Numerical Study on the Characteristics of the System Propeller and Rudder at Low Speed Operation”, Vladimir Krasilnikov et al, Second International Symposium on Marine Propulsors smp’11, Hamburg, Germany, June 2011.
8. “Numerical characterization of a ship propeller”, Borna Seb et al, Faculty of Mechanical Engineering and Naval Architecture, University of Zagreb, Zagreb, 2017.
9. “Scale Effects on a Tip Rake Propeller Working in Open Water”, Adrian Lungu et al, Journal of Marine Science and Engineering, 2019, 7, 404.
10. “Cavitation on Model- and Full-Scale Marine Propellers: Steady and Transient Viscous Flow Simulations at Different Reynolds Numbers”, Ville Viitanen et al, Journal of Marine Science and Engineering, 2020, 8, 141.
11. “Energy balance analysis of a propeller in open water“, Jennie Andersson et al, Ocean Engineering, 158 (2018) 162–170.